
2024 Hiring Statistics: Job Search, Recruiting, AI Jobs, & Interviews

It’s important for job-seekers to stay informed of the latest hiring and recruiting statistics. You have to know the state of the modern job market for a successful job search. You will score your next interview much faster if you know where recruiters find candidates, where candidates find job postings, and which recruiting technologies are popular.
The hiring process has been changing rapidly as it moves online, and the COVID-19 pandemic has accelerated these changes. Reviewing hiring and recruiting statistics in 2024 is a great way for a job-seeker to make sure their job search strategy is up to date. To ensure your job search is successful, it’s important to keep up with the ways the workplace is changing.
Recommended links:
- Our collection of 500+ professional resume examples.
- Our gallery of 20+ downloadable resume templates.
Hiring and recruiting statistics
As you prepare for your job search, it’s important to know what recruiters and hiring managers are looking for. Armed with these recruiting stats you can position yourself strategically to succeed in a competitive job market.
Hiring statistics
Employers say the hiring process takes 27 days on average. (Express Employment Professionals 2020)
63% of employers say it is difficult to fill positions, and 31% of hirers say they have open positions that they cannot fill. (Express Employment Professionals 2020)
60% of recruiters say screening candidates is the most time-consuming part of hiring. (Yello 2020)
18% of recruiters say their biggest challenge in sourcing candidates is finding candidate contact information. (Talent Hero)
Candidates are twice as likely to accept cold emails with brands they have interacted with before. (Officevibe 2017)
95% of employers say it’s difficult to find skilled professionals to hire. (Robert Half 2021)
Another recruiting challenge is writing job descriptions. In one study, 29% of recruiters said it is difficult to separate essential qualifications from preferred qualifications when writing a job posting, and 24% said that it is difficult to identify the necessary soft skills. (Robert Half 2019)
When companies are asked why they haven’t filled their open positions:
- 43% say candidates don’t have the right hard skills.
- 38% say candidates don’t have the right experience.
- 29% say candidates don’t have the right soft skills.
- 29% say candidates aren’t willing to work the hours required.
- 28% say there haven’t been enough candidates.
(Express Employment Professionals 2020)
Soft skills are important to hirers. The top traits that employers look for when hiring are:
- Work ethic/integrity.
- Attitude.
- Communications.
- Cultural fit.
- Critical thinking.
(Express Employment Professionals 2017)
69% of hirers choose adaptability as the top soft skill they are looking for. (LinkedIn 2017)
Candidates don’t always make it easy to find their real skill set. One study found that 34% of applications contain a lie, and 49% of recruiters have caught an applicant lying on their resume. (HR 2012)
26% of recruiters consider cover letters an important part of an application, but 47% of job seekers did not submit a cover letter with their most recent job application. (Jobvite 2017)
When asked to identify their top recruiting challenges:
- 35% of recruiters chose finding interested candidates with the right qualifications.
- 20% said asking the right questions in the interview.
- 19% chose negotiating salary.
(Robert Half 2019)
Scheduling meetings with candidates is also difficult for many employers.
46% of recruiters say last-minute changes are the biggest scheduling challenge. (Yello 2020)
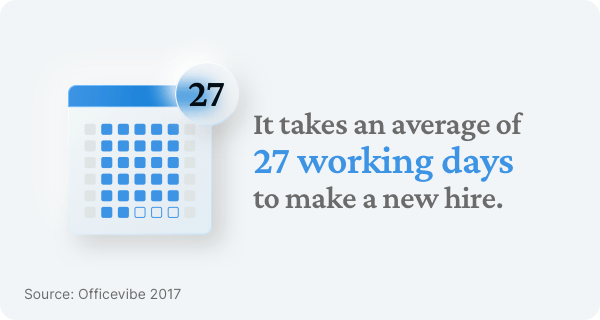
It takes an average of 27 working days to make a new hire. (Officevibe 2017)
69% of companies say that a poor interview process has the greatest impact on the quality of a hire. (Brandon Hall 2015)
51% of companies say that hiring managers have the greatest impact on the quality of a hire. (Brandon Hall 2015)
45% of companies say that screening and assessment have the greatest impact on the quality of a hire. (Brandon Hall 2015)
Only 12% of employees say their company does a great job with onboarding new employees. (Gallup)
46% of recruiters say recruiting is becoming more like marketing. (Officevibe 2017)
60% of recruiters say they regularly lose candidates before they are able to schedule an interview, and 60% say waiting for candidates to send their availability is their biggest scheduling challenge. 38% of recruiters say it takes 1-2 hours to schedule an interview with a single candidate. (Yello 2020)
29% of job-seekers negotiated salary at their most recent position, and 84% of people who negotiate salary secure higher pay. 47% of job-seekers, however, are uncomfortable negotiating salary. (Jobvite 2017)
60% of Gen Z and 57% of Millennials value transparency in the job search. (Yello 2019)
It can cost 6 to 9 months of an employee’s salary to find a replacement. (Gallup)
32% of organizations evaluate candidates during the interview process, while only 5% evaluate candidates during the sourcing process. (Brandon Hall 2015)
Recruiting statistics
In recent years, more and more of the recruitment process has moved online.
29% of Millennials use mobile to apply for jobs. (Yello 2018)
46% of Gen Z have used mobile to apply for jobs. (Yello 2019)
54% of Gen Z won’t complete an application if the methods seem outdated. (Yello 2019)
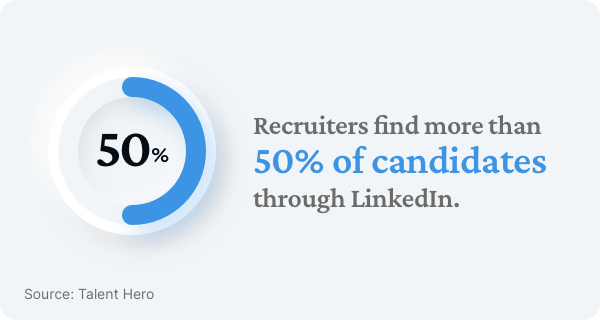
Recruiters find more than 50% of candidates through LinkedIn, and 15% of candidates through Facebook and Twitter. (Talent Hero)
99% of fortune 500 companies use an applicant tracking system to assess candidates. (Jobscan 2019)
25% of job-seekers think that the hardest part of writing a resume is beating the ATS. (Forbes 2020)
51% of recruiters use scheduling software to plan interviews. (Yello 2020)
25% of millennials have texted with an employer during the interview process. (Yello 2018)
33% of millennials have done video interviews. (Yello 2018)
60% of millennials have scheduled interviews online. (Yello 2018)
25% of Gen Z prefer digital communication over face-to-face. (Yello 2019)
50% of hiring managers would be open to navigating to an online portfolio, and 41% of hiring managers would be open to a video resume when coupled with a standard resume. (Career Story 2017)
The trend towards online recruitment accelerated during the COVID-19 pandemic.
One analysis found that 75% of companies conducted remote interviews and onboarding sessions during the pandemic, 61% of companies advertised fully remote jobs during the pandemic, and 60% of companies expanded their candidate search geographically during the pandemic. (Robert Half 2020)
In January 2021, 6.9% of job postings on the job board Indeed gave the option to work remotely, compared with 2.9% in January 2020. (Pittsburgh Post-Gazette 2021)
Interview statistics
Interviewing is a time-consuming task for most employers.
On average, hirers spend two thirds of their time on the interview process, and it takes 3 to four weeks, on average, to complete a hire. Only 25% of companies are able to fill roles within two weeks. (Yello 2020)
Once the interview begins, however, things move quickly.
52% of interviewers make decisions about a candidate 5-15 minutes into the interview. (Workopolis 2015)
To make sure you make the most of the interview as a job-seeker, these interview statistics can be useful to keep in mind.
When asked for their top interview dealbreakers:
- 71% of employers say lying is an instant dealbreaker.
- 67% chose texting during the interview.
- 51% chose swearing.
- 50% said dressing inappropriately.
- 48% said talking negatively about previous employers.
- 45% said that the candidate knowing nothing about the job or company was a major dealbreaker.
(The Harris Poll 2018)
In one study of CIOs who were responsible for conducting in-person interviews, respondents indicated that these behaviours would make the candidate less appealing:
- 20% said speaking negatively about past employers or managers.
- 19% chose poor body language.
- 16% said unpreparedness.
- 15% chose a poor understanding of the business.
- 15% said a poor explanation of their career history.
- 13% said unprofessional clothing.
(Robert Half 2018)
When it comes to video interviews:
- 88% of recruiters’ number one pet peeve during video interviews is internet lag.
- 95% of recruiters prefer cool light to warm light during video interviews.
- 97% of interviewers prefer an office-themed backdrop if a candidate uses a virtual background.
(Harvard Business Review 2021)
Professional self-presentation is integral to a good interview. When asked what body language mistakes candidates make in interviews:
- 68% of employers chose failure to make eye contact.
- 38% chose failure to smile.
- 32% said fidgeting too much.
- 31% chose bad posture.
- 31% said crossing arms.
- 22% chose a weak handshake.
(The Harris Poll 2018)
In one study, 80% of video interviewees who did not receive an offer appeared distracted or disengaged during the interview, and 42% read from notes too much. (Harvard Business Review 2021)
Interviews are a two-way street. 63% of candidates say they aren’t happy with employer communication during the application process, and only 25% of job candidates say that their candidate experience is great. (TalentLyft 2020)
69% of candidates who have had a negative experience say they wouldn’t apply at that company again. (TalentLyft 2020)
60% of applicants have quit an application that took too long. (Officevibe 2017)
Resume statistics
Getting your resume right is integral to a job search.
30% of job-seekers think that the hardest part of writing a resume is finding the right keywords, and 29% think the hardest part is describing achievements. (Forbes 2020)
80%+ of employers say relevant past work experience is the most important part of a standout resume. (Career Story 2017)
In one study, hiring authorities identified several resume preferences. Keep these in mind to make sure your resume stays at the top of the pile:
- 60% of hiring authorities prefer 2-page resumes.
- 79% of employers prefer to receive resumes in a PDF format.
- 77% of employers prefer employment dates with both the month and the year.
- 49% of hirers prefer to see up to ten years of experience on a resume.
- 21% of employers like to see 10-15 years of experience on a resume.
(Career Story 2017)
CIOs identified these mistakes as their top red flags to avoid:
- 21% chose frequent job hopping.
- 17% said poor formatting and typos.
- 17% said excessive length.
- 12% chose overuse of technical jargon.
(Robert Half 2018)
- 70% of hiring managers say they are most annoyed by poor spelling and grammar in resumes.
- 50%+ of hiring managers say they are most frustrated by poorly targeted resumes.
- 50%+ of hiring managers say they are most annoyed by disorganized resumes.
- 59% of employers chose job-hopping as a major red flag.
- 49% of employers chose unrelated experience as their biggest resume red flag.
- 40% of employers say gaps in employment are a resume red flag.
(Career Story 2017)
Job market statistics

With an understanding of current job market statistics you can gain insight into the positions and salaries you will be competing for.
Workforce statistics
51% of employers expect to add new positions in 2021. (Robert Half 2021)
64% of job-seekers are satisfied at work. (Jobvite 2017)
40% of hirers expect their IT department to expand in 2021. (Career Impressions 2021)
36% of hirers expect their customer service department to expand in 2021. (Career Impressions 2021)
34% of hirers expect their marketing department to expand in 2021. *(Career Impressions 2021) *
81% of workers are open to new job opportunities. (Jobvite 2017)
The best candidates are off the market within 10 days. (Officevibe 2017)
40% of the workforce is considering leaving their employer this year. (Microsoft 2021)
Some studies have found that your first job can affect the rest of your career.
87% of workers whose first job matches their education level continue to be appropriately employed 5 years later, and 91% of those appropriately employed at 5 years were still appropriately employed at 10. (Burning Glass 2018)
43% of workers’ first job is below their education level, however, and workers who start out underemployed are 5 times more likely to remain underemployed 5 years later. (Burning Glass 2018)
This means it’s important to find a job that matches your skills.
43% of organizations are facing skills gaps, and 44% of organizations say they will face skills gaps in the next 5 years. (Mckinsey 2020)
45% of hirers say that adaptability and creativity are essential skill sets. (Career Impressions 2021)
41% of hirers say that critical thinking and problem solving are essential skill sets. (Career Impressions 2021)
40% of hirers say that financial management is an essential skill set. (Career Impressions 2021)
Employee turnover can be as high as 50% in the first 2 years of employment. (Gallup)
When organizations were asked which departments they were expecting a skills gap in:
- 43% said data analytics.
- 26% said IT.
- 25% chose executive management.
(Mckinsey 2020)
When asked how they have tried to close the skills gap, organizations in North America answered:
- 67% of hirers have used hiring to close the skills gap.
- 51% have tried building skills.
- 57% have employed contractors.
(Mckinsey 2020)
1 in 6 workers won’t get a raise in 2021. (Bloomberg 2021)
41% of Millennial graduates expect to make $60-85k in their first year of work. (Yello 2018)
70% expect to make $60k or more. (Yello 2018)
Men are almost twice as likely as women to expect salaries greater than $85k. (Yello 2018)
Women are 30% more likely to find roles at a hiring event. (Yello 2018)
25% of Gen Z graduates expect to make less than $30k in their first job. (Yello 2019)
18% of Gen Z graduates expect to make between $60 and $85k. (Yello 2019)
When Gen Z are asked what information sources for jobs they trust most:
- 62% say referrals.
- 56% choose job boards.
- 55% say company websites.
- 55% choose career centres.
- 51% say hiring events.
(Yello 2019)
55% of Gen Z employees and 38% of Millennials expect to work for their current employer for less than 3 years. (Yello 2019)
25% of Gen Z employees and 39% of Millennials expect to work at their current company for 5 years or more. (Yello 2019)
Internship statistics
31% of Gen Z graduates started their job search in senior year. (Yello 2019)
35% of Gen Z graduates expect to receive more than one job offer. (Yello 2019)
36% of Gen Z graduates worry about finding a job. (Yello 2019)
53% of students believe that their major will lead to a good job. (Gallup 2017)
47% of women are underemployed after graduating. (Burning Glass 2018)
37% of men are underemployed after graduating. (Burning Glass 2018)
Underemployed workers make $10,000 (27%) less, on average, than appropriately employed workers. (Burning Glass 2018)
34% of students believe that they will graduate with the skills to succeed in the job market, and 36% believe they will have the skills to succeed in the workplace. (Gallup 2017)
90% of graduates say that their employment is directly related to their education. (NACE 2017)
65% of people with a degree in security and law enforcement are underemployed in their first job. (Burning Glass 2018)
63% of people with an education in parks, recreation, and fitness studies are underemployed in their first job. (Burning Glass 2018)
30% of engineering and computer science majors are underemployed in their first job after graduating. (Burning Glass 2018)
Of Gen Z graduates with a 4-year degree:
- 16% majored in science.
- 13% majored in social science.
- 13% majored in business.
- 11% majored in healthcare.
(Yello 2019)
71% of graduates plan to enter the workforce. (NACE 2017)
23% of graduates plan to continue their education. (NACE 2017)
The top 5 employer benefits according to graduates are:
- Employer-paid medical insurance.
- Company-matched 401(k).
- Guaranteed annual raises.
- Dental insurance.
- Family-friendly benefits.
(NACE 2017)
From 2013 - 2017 60% of students participated in an internship or co-op. (NACE 2017)
70% of employers who hire interns offer their interns full-time jobs, and up to 80% of interns accept the offers. (smallbizgenius 2021)
31% of internships start after the intern has graduated college. (Chegg 2020)
81% of graduates who took an internship say that the internship significantly impacted their career. (NACE 2017)
50% of workers who do an internship do more than one, including 27% who do 2 and 13% who do 3. (Chegg 2019)
53% of graduates say that their current position was gained through an internship. (NACE 2017)
60% of employers said that they would be more likely to consider hiring a candidate if they had completed an internship. (NACE 2017)
At some companies, most of the permanent workforce is made up of former interns.
- 89% of US Congress employees completed an internship.
- 84% of PwC employees completed an internship.
- 80% of Facebook employees completed an internship.
- 78% of Google employees completed an internship.
- 70% of IBM employees completed an internship.
- 55% of Apple employees completed an internship.
- 49% of Lyft employees completed an internship.
(Chegg 2019)
59% of employers assist interns with housing costs and travel expenses related to the position. (NACE 2019)
24% of internship candidates said they would prefer it if their first job was remote, while 38% had no preference and 38% said they would feel like they were missing out. (CareerUp 2020)
38% of summer internship candidates in 2020 had their internship cancelled due to the COVID-19 pandemic and could not find a new one, and 14% of internships were transitioned to remote work. (CareerUp 2020)
Canadian job market statistics
Canada’s employment rate in February 2021 was 59.4%, down from 61.8% in February 2020. (CBC 2021)
Canada’s unemployment rate in February 2021 was 8.2%. (CBC 2021)
In March 2021, 53% of Canadians said they were $200 from insolvency. (Financial Post 2021)
25% of Canadians say they took on more debt because of the pandemic. (Financial Post 2021)
Canada’s labour force participation was 64.7% in February 2021. (Statisics Canada 2021)
23.8% of Canadians working part time want a full-time job. (Statisics Canada 2021)
Cost of a bad hire statistics
Recruiters have to be careful who they hire. Replacing a bad hire takes a lot of time and a lot of money.
The average cost of a bad hire is $14,900, and the average cost of losing a bad hire is $29,600. (Career Builder 2017)
It takes an average of 52 days for employers to fill an open position. (Glassdoor 2017)
32% of employers say a bad hire results in lost time to find and train a replacement. (Career Builder 2017)
It costs 1.5x an employee’s salary to replace them. (LinkedIn 2017)
Companies spend $4000 on average to fill an open position. (Glassdoor 2017)
The average cost of hiring an executive is $3,798.65. (Brandon Hall 2015)
The average cost of hiring mid-level managers is $1,501.79. (Brandon Hall 2015)
The average cost of hiring entry-level positions is $740.63. (Brandon Hall 2015)
75% of managers have made a bad hire. (Robert Half 2021)
64% say the negative impact of a bad hire is worse than it was a year ago. (Robert Half 2021)
It takes 10 weeks on average to terminate a bad hire, and 6 weeks to restaff the position. (Robert Half 2021)
37% of employers say that a bad hire results in lower productivity. (Career Builder 2017)
31% of employers say a bad hire compromises quality of work. (Career Builder 2017)
44% of CFOs say a bad hire will greatly impact the morale of their team. (Robert Half 2018)
66% of workers have accepted a job that was a bad fit. (Career Builder 2017)
Of workers who took a job that was a bad fit, 50% quit within 6 months and 36% stayed in the role. (Career Builder 2017)
30% of bad hires failed as a result of a mismatched skill set. (Robert Half 2019)
26% of bad hires failed as a result of unclear performance expectations. (Robert Half 2019)
23% of bad hires failed as a result of personality conflicts. (Robert Half 2019)
CFOs estimate that 26% of working hours are spent coaching underperforming employees. (Robert Half 2018)
A bad hire can cost 30% of the employee’s first year of earnings and 10% of sales opportunities. (Next Generation Recruitment 2015)
27% of companies in the UK say that bad hires cost them £50,000 or more. (Next Generation Recruitment 2015)
95% of employers make bad hires. (Brandon Hall 2015)
In the UK, it costs companies an average of £30,614 to replace an employee. (Recruiting Times 2015)
In the UK, it costs an average of £39,887 to replace a legal worker, £39,230 to replace accountancy workers, £31,808 to replace IT employees, and £20,114 to replace retail workers. (Recruiting Times 2015)
Related: UK CV Format, Examples and Requirements
According to employers, 35% of bad hires thought they could learn skills that they didn’t have. (Career Builder 2017)
According to employers, 33% of bad hires lied about their qualifications. (Career Builder 2017)
According to employers, 32% of bad hires are a result of the employer taking a chance on someone they like. (Career Builder 2017)
30% of bad hires are a result of the hirer feeling pressure to fill the position quickly. (Career Builder 2017)
Company culture statistics
Company culture is as important as salary to many job seekers. Review company culture statistics so you know what employers and workers expect from each other in the modern economy.
Office culture statistics
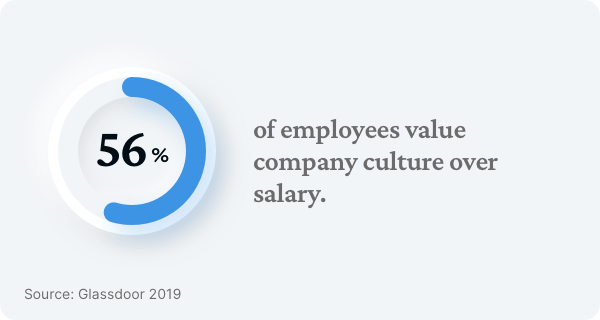
77% of adults take company culture into account before applying for a job, and 56% of adults value company culture over salary. (Glassdoor 2019)
33% of workers in the United States say stress on the job has caused them to behave poorly with family or friends, as have 39% in Brazil, 33% in Canada, and 25% in Japan. (Gallup 2007)
A study in Germany found that 71% of workers strongly agree that their manager is fully aware of their projects and tasks, and 65% strongly agree that they communicate with their manager daily. (Gallup 2015)
89% of adults think an employer should have a clear mission and purpose. (Glassdoor 2019)
50% of employees know what is expected of them at work. (Gallup 2015)
73% of job-seekers would not apply at a company who does not share their values, and 65% of adults say they will stay in a job if they support the company’s values. (Glassdoor 2019)
66% of candidates say interactions with employees are the best way to learn about a company. (Officevibe 2017)
Employer communication and expectations are an important factor in the culture of a workplace.
12% of employees say that their manager helps them set work priorities and 13% agree that their manager helps them set performance goals. (Gallup 2015)
Workers knowing what's expected of them at work can correlate with productivity gains of 5% to 10%, and 10% to 20% fewer on-the-job accidents. (Gallup 2007)
32% of Americans are enthusiastic and engaged in their work and workplace, compared to 13% of employees worldwide. (Gallup 2016)
More than 50% of employees aged 18 to 24 feel that someone at work encourages their development. (Gallup 2007)
Organizations that make an effort to maximize their employees’ talents can increase engagement levels by 33% per year. (Gallup 2015)
40% of employees don’t think their manager is guiding their development, including 4 in 5 workers with 10 or more years at a company and 3 in 4 workers over 55 years of age. (Gallup 2007)
53% of employees say work-life balance is an important part of whether they accept a job. (Gallup 2020)
42% of employers offer a wellness plan. (Staples 2019)
84% of employers plan social activities for interns. (NACE 2019)
52% of remote workers use a work-provided computer when working at home. (Staples 2019)
40% say their office is too open. (Staples 2019)
Side-hustle statistics
34% of Americans have a side-hustle, and 24% plan to start a side-hustle. (Zapier 2021)
25% of job-seekers have a second source of income. (Jobvite 2017)
When asked why they have have a side-hustle, respondents said:
- 46% of respondents wanted to create a passive income.
- 38% wanted to do something fun.
- 33% started a side hustle to diversify their income.
- 28% wanted to develop new skills
- 25% wanted to save for a specific financial goal.
(Zapier 2021)
Remote work statistics
From 2012 to 2016, the percentage of remote employees who spent 80% to 100% of their time working remotely increased from 24% to 31%. (Gallup 2020)
This trend accelerated during the COVID-19 pandemic.
In the early months of 2021, 32% of Canadian employees aged 15 to 69 worked remotely most of the time, whereas only 4% did in 2016. (Statistics Canada 2021)
During the pandemic, 84% of Information/TMT services employees worked remotely. (Mckinsey 2020)
During the pandemic, 74% of business service employees and 70% of financial activities employees worked remotely. (Mckinsey 2020)
83% of companies plan to allow more people to work from home and adjust their schedule after the pandemic ends. (CNN 2020)
67% of companies said that their company productivity stayed the same during the pandemic, and 27% said it was higher. (CNN 2020)
73% of companies expect a quarter or more of their workforce to continue working remotely post-pandemic. (CNN 2020)
This trend is not consistent across industries, however.
While 49% of workers with a graduate degree worked from home in February 2021, fewer than 10% of people with only a high school degree did. (Pittsburgh Post-Gazette 2021)
62% of workers with a bachelor’s degree or more education say their work can be done from home, while only 23% of those without a four-year college degree say the same. (PEW 2020)
Many businesses have pursued a hybrid model, where employees work both from home and in the office.
72% of companies plan to implement more scheduling flexibility after the pandemic. (CNN 2020)
46% of hiring professionals expect a hybrid of a remote and in-office workforce following the pandemic, and 34% expect a fully remote workplace. (Robert Half 2021)
According to 34% of employers, the greatest advantage of hybrid teams is their flexibility, while 21% of employers say the greatest advantage is business continuity and productivity. (Robert Half 2021)
66% of professionals say they are more productive working remotely than they are in an traditional office. (Flexjobs 2017)
73% of workers want to have the option to work remotely after the pandemic ends. (Microsoft 2021)
When employees are asked why they would want a flexible work option:
- 78% say work-life balance
- 49% say family
- 46% say time savings
- 45% say commute stress
(Flexjobs 2017)
62% of workers have left or considered leaving a job because it did not offer flexible schedules. (Flexjobs 2017)
In one study of new remote workers:
- 90% of respondents reported being at least as productive as they were in their usual workplace.
- 58% reported roughly the same productivity.
- 32% reported being more productive
(Statistics Canada 2021)
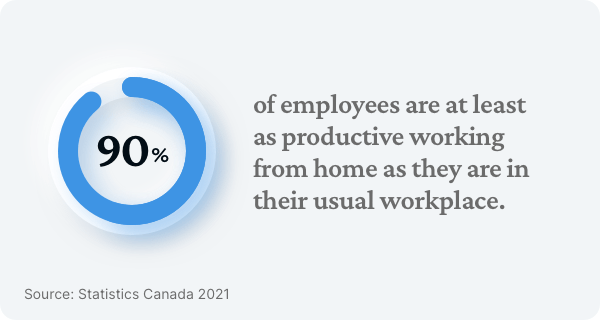
48% of employees who are more productive while working from home work longer hours per day than they did in the office. (Statistics Canada 2021)
45% of people say that a flexible job would improve their quality of life. (Flexjobs 2017)
78% of people say having a flexible job would allow them to be healthier, and 86% say it would reduce stress. (Flexjobs 2017)
90% of employees say flexible work arrangements improve morale. (Staples 2019)
60% of remote workers who are choosing not to work from the office say they are working from home because they prefer it. (PEW 2020)
52% of employees say open offices create distractions. (Staples 2019)
10% of people say that they do less work per hour while working from home. Of those, 44% work longer hours per day while working remotely. (Statistics Canada 2021)
When employees who are less productive while working remotely are asked why:
- 22% identified a lack of interaction with co-workers.
- 20% reported having to care for children or other family members.
- 11% identified difficulty accessing work-related information or devices.
- 13% reported having to do additional work to get things done.
(Statistics Canada 2021)
When workers were asked why they were more productive working remotely:
- 76% said fewer interruptions from colleagues.
- 76% said fewer distractions.
- 70% chose reduced stress from commuting.
- 69% chose minimal office politics.
- 62% identified less noise.
- 54% chose more comfortable clothes.
(Flexjobs 2017)
Among new remote workers:
- 41% indicated that they would prefer working about half of their hours at home and the other half in the office.
- 39% preferred working most or all of their hours remotely.
- 20% would prefer working most or all of their hours outside the home.
(Statistics Canada 2021)
51% of job-seekers would switch to a job that allows them flextime. (Gallup 2020)
In 2008, 31% of people spent less than 30 minutes commuting, 35% spent 30-60 minutes, and 16% spent 60-90 minutes. (Gallup 2020)
In 2019, 37% of people spent less than 30 minutes commuting, 29% spent 30-60 minutes, and 17% spent 60-90 minutes. (Gallup 2020)
Covid-19 workplace statistics
47% of Americans are working from home at least part time as a result of COVID-19. (Glassdoor 2021)
70% of Americans who work from home think vaccinations should be required to return to the office. (Glassdoor 2021)
44% of hirers expect to make adjustments for part-time remote work after the pandemic ends, and 42% expect to accommodate flextime. (Career Impressions 2021)
86% of remote workers would like to continue working from home full- or part-time after the pandemic ends. (Glassdoor 2021)
68% of organizations expect to back-fill roles that were eliminated as a result of the COVID-19 pandemic. (Career Impressions 2021)
42% of hiring personnel say that salaries for new employees hired during or after the pandemic will be less than salaries pre-pandemic. (Career Impressions 2021)
40% of hirers say that salaries for employees hired during or after the pandemic will be the same as salaries pre-pandemic. (Career Impressions 2021)
The OECD unemployment rate in February 2021 was 6.7%. (OECD 2021)
28% of internship candidates considered changing their career path or major because of COVID-19. (CareerUp 2020)
57% of remote workers who are choosing not to work from the office say they are working from home because they are concerned about contracting COVID-19. (PEW 2020)
54% of people who can do their jobs from home would prefer to work from home all or most of the time when the coronavirus outbreak is over. (PEW 2020)
23% of workers say they are less satisfied with their job than they were before the pandemic, while 13% say they are now more satisfied. (PEW 2020)
When asked about specific aspects of their job:
33% of people who began working remotely during the COVID-19 pandemic say they feel less connected to their co-workers. (PEW 2020)
26% of people who began working remotely during the COVID-19 pandemic say it’s harder for them to achieve work-life balance. (PEW 2020)
16% of people who began working remotely during the COVID-19 pandemic say it’s harder to know what their manager expects of them. (PEW 2020)
67% of workers want more in-person collaboration after the COVID-19 pandemic ends. (Microsoft 2021)
Hiring and recruiting statistics reveal some interesting things about the modern workplace. The job search, the interview process, and the office have all changed a great deal in recent years. The numbers clearly show that more and more of professional life has moved online, and as technology improves, this trend is likely to continue. Companies and employees alike are having to adjust to this new paradigm. As a worker and as a job-seeker, it is integral for you to stay engaged and productive in the face of the changing workplace.

Written By
Ben Temple
Community Success Manager & CV Writing Expert
Ben is a writer, customer success manager and CV writing expert with over 5 years of experience helping job-seekers create their best careers. He believes in the importance of a great resume summary and the power of coffee.

Learn how your resume can beat the applicant tracking system (ATS) with keywords and the right resume template.
February 7, 2022
Read Post

Community Success Manager & CV Writing Expert

Over 50+ professional cover letter examples to include with your job application - easy to create a custom cover letter for each application.
April 12, 2022
Read Post

VP Marketing & Resume Expert
![The 2024 Resume Writing Guide [+ Job Search Tips and Resume Examples]](/static/0a451b7c20b67c3a0ce6a7b4a7680f5f/61ca5/Resume_Guide.jpg)
The 2024 Resume Writing Guide is filled with quality job search tips, resume examples and information you need to know before writing your resume or CV.
October 11, 2024
Read Post

VP Marketing & Resume Expert
Copyright ©2024 Workstory Inc.