Data Analyst Resume Builder
Build an ATS-friendly resume in minutes. Download a polished PDF or Word file.
Sign-up FREE. No Credit Card Required.

Build an ATS-friendly resume in minutes. Download a polished PDF or Word file.
Sign-up FREE. No Credit Card Required.
Trusted by 75k+ data analysts, VisualCV pairs polished design, ATS optimization, and AI guidance to help you highlight the metrics, tools, and business impact hiring managers want to see.

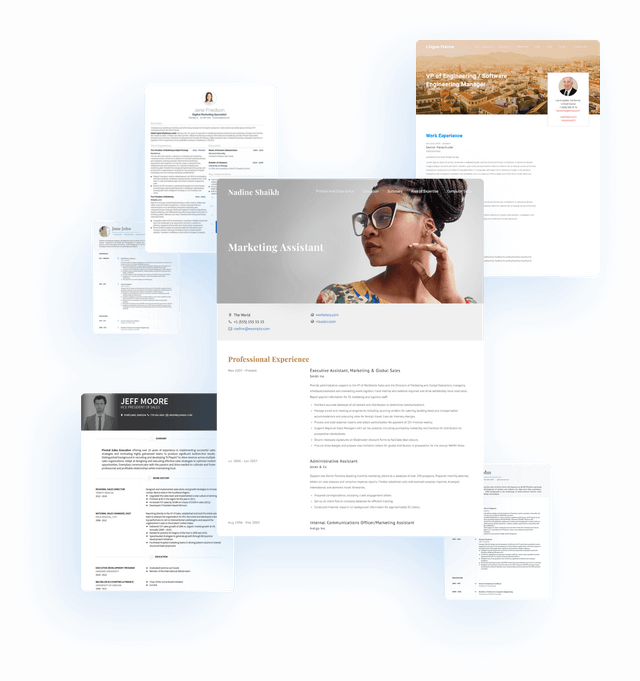
Explore data analyst resume examples to clarify your approach or find inspiration. These job-winning resumes show how candidates present tools, findings, and measurable impact in ways hiring teams can assess.
For over a decade, we have researched and written specific resume, cover letter, and job search advice that is hard to find elsewhere. Use our free resources to pursue your next data analyst role.


Use design tools that make it easy to balance a modern look with a professional tone. Every template has been tested and refined over a decade to support clear, credible data analyst resumes.

Tailor your resume for each data analyst job without starting over. Customize sections, skills, and achievements in standout templates, so your most relevant analysis experience stays easy to find.

An ATS-optimized, customized resume helps your data analysis skills and results reach the right readers. With your application ready, you can focus on preparing confident interview answers.

VisualCV helps data analysts turn experience into a clear, tailored resume that eases the pressure of every application.
Use a reverse-chronological resume with a concise skills section and, when relevant, a projects section. This format lets a recruiter scan your most recent analytical work first while a hiring manager can quickly trace the path from business question to data source, SQL or spreadsheet work, validation, dashboard or report, and recommendation. It also keeps dates and progression visible, which a functional resume often obscures.
Give visual priority to the evidence closest to the role you want. Put your name and contact details first, then a brief summary only if it adds clear domain context. Follow with experience, then projects if they strengthen your case, and reserve a compact skills section for tools you can discuss accurately.
Recommended order:
Do not give equal visual weight to every platform you have encountered. A long tools list can crowd out the work that proves your level of ownership.
Before: SQL, Excel, Tableau, Power BI, Python, data analysis
After: Built and maintained Tableau reporting for weekly operations reviews; queried source tables in SQL, checked metric definitions with operations leads, and documented exceptions for follow-up.
Use a combination format only when your recent title does not reflect your analytical work, such as a career change from operations, finance, or marketing. Keep a chronological employment record, but place a targeted projects or selected analysis section above it to establish relevant capability. For an entry-level data analyst, lead with projects that read like short case studies: the question, data source, cleaning or validation work, analysis, deliverable, and finding. A functional format that groups work under broad labels such as “data analysis” or “reporting” rarely provides enough context about when, where, or how you used the skill.
Use one page when your experience and projects fit without cramped text. Add a second page when you need it to preserve substantive analyst work, such as multiple roles with distinct reporting, data-quality, dashboard, or stakeholder responsibilities. Clean headings, standard section names, and consistent dates make the document easier to scan and parse without turning it into a generic template.
Your data analyst resume should put contact details and a focused top statement first, then show analytical work, supporting qualifications, and accessible portfolio evidence.
Put your name and contact information at the top, with a location and relevant professional link. Use a summary when you can establish relevant analyst experience or a clear specialty. Use a targeted objective only when you are entering analytics or changing careers and it clarifies your direction. Do not use both unless each adds distinct information.
Example: "Operations data analyst with experience preparing service and capacity data, maintaining recurring performance reporting, and translating metric trends into planning recommendations for operations leaders."
Use experience for analyst work or transferable roles where analysis was a meaningful part of the job. Show the analytical path:
Include data-quality work when it improved the reliability of reporting, such as reconciling definitions or investigating anomalies. When figures are restricted, use approved non-sensitive scope or outcomes without exposing restricted data.
Example: "Built and maintained Tableau reporting for regional sales reviews, validating source extracts and documenting metric definitions so commercial teams could compare performance consistently."
Use selected projects when your employment history lacks relevant analyst evidence. Identify the question and data source, then name the deliverable and your contribution. Academic, bootcamp, freelance, and portfolio work can belong here when it demonstrates skills or domain context not yet visible in experience.
Group skills by the work you performed and distinguish independent use from coursework exposure. State your actual dashboard ownership rather than treating viewing, refreshing, maintenance, and development as equivalent.
List your degree and institution, plus graduation or expected date. Add relevant coursework only early in your career when it clarifies preparation. Place completed certifications with education or on a credentials line, and label in-progress study accurately.
Link only to accessible work with enough context to assess it. A restricted or inaccessible sample belongs in your experience section, not behind an empty portfolio link.
Build your data analyst resume from evidence that shows how you turned a business question into usable analysis, a deliverable, and a decision or recommendation. Start with one target posting, not a generic inventory of every tool, course, and dashboard you have touched.
Read the posting for the work it describes. Note the business context, data sources or systems, requested tools, expected reports or dashboards, and the audiences using the work. Use its language only where you can support it with an experience or project example.
Choose roles, projects, and coursework that demonstrate relevant analysis, data quality work, reporting, or stakeholder communication. Keep tool claims specific to work you performed independently, and omit platforms you could not explain in an interview.
For example, evidence of SQL is stronger when you can describe the data work it supported, such as validating order exports before preparing a weekly operations report.
Write bullets that connect the analysis task, your contribution, and the resulting output or decision. Add an outcome only when you can support it with a number, approved range, process scope, reporting cadence, or decision informed.
Before:
"Created Power BI dashboards and analyzed sales data."
After:
"Prepared and validated sales data from CRM and order-system exports, then built a Power BI dashboard for weekly pipeline reviews and documented metric definitions for sales leadership."
Place the strongest relevant experience or project evidence near the top, then use the posting to adjust emphasis and wording. Keep the skills list selective, with each major tool reinforced by evidence elsewhere in the document rather than copied keywords.
Run a final check before submitting:
Strong data analyst experience shows how you moved from a business question or data source to validated analysis, a usable deliverable, and a decision or reporting need. Employers need more than SQL, Excel, Tableau, or Python in a skills list. Your bullets should establish what you owned, the preparation or validation work you performed, the analysis or reporting work you completed, and the audience you supported.
Communicate scope without exposing restricted information. You can name the data type, source systems, business units, reporting cadence, stakeholder group, and level of ownership. Quantify real scope when it clarifies the work, such as the number of reports, data sources, or teams served; when figures are confidential or unavailable, state the defensible outcome, such as a standardized definition or a consistent basis for prioritization.
Separate recurring responsibilities from one-off analysis. For recurring work, describe the reporting cadence, data checks, report or dashboard you maintained, and the teams that used it. For a one-time request, describe the question, source data, analysis performed, finding or recommendation, and final deliverable.
Start each bullet with the work you actually performed, then add context and scope. Meaningful responsibilities include:
Describe tool ownership accurately. Do not claim independent SQL analysis or dashboard development if you reviewed existing queries, refreshed a report, or maintained an established dashboard.
Before:
Used SQL and Tableau to create reports.
After:
Queried and validated customer support data in SQL, then built a Tableau dashboard that gave operations leaders a shared weekly view of ticket volume, resolution time, and backlog trends.
The stronger version identifies the data source, validation work, deliverable, audience, and reporting cadence without claiming an unsupported business result.
Strong data analyst accomplishments distinguish between work you were assigned and evidence that your analysis was effective or used. A responsibility names a task, such as preparing a report or querying data. An accomplishment shows the analytical contribution, its scope, and what changed after stakeholders used it.
Build each accomplishment around a real piece of analytical work:
For analyst resumes, results can include:
Before: “Created dashboards in Power BI and analyzed sales data.”
After: “Built a weekly Power BI sales-performance dashboard that reconciled order and CRM data, documented conversion definitions, and gave regional managers a consistent view of pipeline trends.”
The second version does not need an invented revenue figure. It shows what you did, the reporting scope, and a usable outcome.
Use one defensible metric when it clarifies scale, quality, frequency, time, or adoption. If a number would be speculative or restricted, use a specific qualitative outcome instead of inventing business impact. Useful evidence includes:
If customer, financial, health, or client data is confidential, describe the scale without exposing it. “Validated multi-source operational data for a regional service team” is more informative than omitting scope and safer than naming restricted figures or clients.
Example: “Investigated mismatched fulfillment metrics across warehouse and order-management exports, reconciled field definitions with operations, and delivered an Excel exception report that gave supervisors a consistent weekly backlog view.”
A data analyst resume should show how you turn raw data into decision-ready work. That means foregrounding data preparation; analysis; reporting; and decision support. For adjacent titles, business analyst applications should foreground requirements and process analysis when that is the work. Data-science claims need evidence of modeling; inference; or experimental methods. Do not add a platform or method only because it appears in a posting.
Move dashboard ownership and dependable reporting operations up. Reduce emphasis on one-off analysis. Show whether you built or maintained reporting, validated refreshes, resolved data issues, or documented KPI logic.
Example: “Maintained weekly Power BI operations reporting. Validated source-data refreshes and documented KPI definitions for regional managers.”
Move user-behavior analysis and the product decision it informed up. Reduce dashboard-only claims. Use event data to show how you investigated a funnel, retention pattern, feature adoption question, or experiment.
Example: “Analyzed onboarding funnel events in SQL. Identified a drop-off point and presented findings that informed a revised activation flow.”
Move campaign performance and marketing-partner reporting up. Reduce attribution claims when your work was limited to channel-level reports. Show campaign-data preparation, platform-definition reconciliation, audience analysis, or conversion-funnel reporting.
Example: “Combined campaign and CRM exports in Excel. Produced a monthly lead-to-opportunity report for demand generation stakeholders.”
Move reconciliations and financial controls up, along with planning context. Reduce generic visualization language. Prioritize variance analysis, forecasts, budgets, revenue or cost drivers, and the review process around the numbers. Describe scale through reporting cadence or business-unit scope when figures are restricted.
Example: “Investigated monthly expense variances. Reconciled source reports to finance records and prepared commentary for budget owners.”
Move process performance and data-quality work up. Reduce chart-focused descriptions. Show the operational definition you used and the imperfect source data you handled, whether the question concerned service levels, capacity, inventory, quality, or turnaround time.
Example: “Cleaned duplicate order records and analyzed fulfillment exceptions. Gave warehouse leaders a weekly view of recurring delays.”
Move ambiguous business problems and governance work up. Reduce introductory coursework and isolated tool exercises. Show judgment through metric definitions, data-quality decisions, stakeholder influence, reusable reporting processes, or mentoring and review work.
Example: “Partnered with product and finance teams to align active-user definitions. Documented calculation logic and established a shared executive metric.”
Move analytical projects and adjacent work up. Reduce tool-only project descriptions. Frame customer service, research, finance, or operations experience as a case study: name the question, source system, preparation work, analysis, deliverable, and limitation. List only tools you used independently.
Before: “Created a Tableau dashboard using sales data.”
After: “Cleaned a public retail dataset and built a Tableau dashboard to examine monthly sales and returns. Summarized source-data limitations alongside the findings.”
Use a portfolio link only when it leads to accessible work that expands the resume claim. Name the project beside the link so the reviewer knows whether it contains a SQL analysis, Power BI report, or Python notebook.
Use explicit posting terms for software, deliverables, and methods you genuinely used, then demonstrate broader analytical capabilities in experience and project bullets.
Reuse terms from the posting when they accurately match your background. Tool names, reporting deliverables, and named methods are useful explicit keywords because they help connect your resume to the role, but each needs evidence elsewhere on the page.
Organize capability terms around the work you can support:
List forecasting, statistical analysis, or experimentation only when a bullet can describe the analysis you performed and the conclusion it informed. Put software organization and precise ownership labels in your tools section rather than repeating a tool inventory here.
Data quality, dashboard ownership, stakeholder communication, and business impact need context. Show the relationship between the data source, your analytical work, the deliverable, and the decision it supported.
Weak:
Better:
"Queried and validated order data in SQL, resolved duplicate-record issues, and built a Tableau dashboard that gave operations leaders a weekly view of fulfillment exceptions."
The stronger version establishes a workflow. It says what data you handled, what problem you addressed, what you delivered, and who could use it. Adapt that shape to your own work without adding results you cannot support.
Group skills by work you can perform independently. A course module, one-time project, and daily production work do not represent the same capability. Keep brief exposure in a short secondary list or leave it out.
Preserve the business context that makes your work meaningful. Finance analysis may involve reconciliations and variance analysis. Marketing work may examine campaign performance or conversion funnels. Product work can address user behavior and experiment results, while operations analysis may focus on capacity, service levels, or exceptions.
If details are confidential, describe approved scope without exposing records, clients, or proprietary figures. You can name a business unit, recurring reporting process, or percentage change when accurate.
List named systems in a compact Technical Skills section, then repeat them in experience or project bullets only when they were material to work you can explain accurately.
Source systems and warehouses provide data; SQL and transformation tools prepare it; data models or semantic layers define metrics; BI platforms produce stakeholder-facing dashboards and reports. These stages are not interchangeable.
Use this section when a posting names platforms or your work crosses systems. Group by function, not courses or every tool opened:
Describe dashboard ownership precisely: consumed means you used an existing report; maintained means you refreshed or updated it; developed means you built its model and metric logic, then created calculations and visuals.
Put a tool in a bullet, not only skills, when it shaped analytical work or a deliverable. Tie it to the data used and output delivered.
Before: "Used SQL / Excel / Tableau for reporting."
After: "Queried order and support-ticket data in SQL; reconciled duplicate records in Excel; built a Tableau dashboard for weekly service-level reviews with operations leaders."
This context distinguishes substantive use from a software-name dump.
List data analyst certifications in a dedicated Certifications section with the exact credential name, issuing organization, and completion status. Put the section near Education if you are early in your career, or after Skills if the credential is relevant to the role. If a posting specifically names a credential, place it where it is easy to find, but let your experience or projects show how you applied the related SQL, Power BI, Tableau, Excel, or Python skills.
Separate a completed certification from a course, badge, or planned exam. A certificate can support an entry-level resume or a move into analytics, but it does not establish the same thing as independently querying data, validating metric definitions, or delivering a dashboard for stakeholders. For work in progress, write the official program or exam name followed by “In progress” and an expected completion date. Do not write “certified” until you hold the credential, and do not imply that a course gave you tool proficiency beyond what you can discuss and demonstrate.
Example:
Credential value varies by employer, industry, and location. A finance, healthcare, product, or operations team may care more about your domain knowledge, reporting workflow, or data-governance awareness than a general certificate. If you have a degree, relevant coursework, or a bootcamp project but no formal credential, label each accurately rather than grouping them together. Use the credential name that appears on your record, and omit expired, incomplete, or unrelated certificates that do not support the analyst role you are pursuing.
You can write a credible data analyst resume without a formal analyst title by treating applied projects, internships, coursework, freelance work, and analytical responsibilities from other jobs as evidence of how you work with data. Place your strongest work in a Projects section or, when it was part of a paid role, beneath that role. For each entry, show the business question, data source, cleaning or validation work, analysis method, deliverable, and finding or recommendation.
Useful substitutes for direct analyst experience include:
Do not rename a course project as professional client work or describe a dashboard you only viewed as one you built. State your ownership precisely. “Wrote SQL joins and validated results” means something different from “reviewed existing SQL queries,” just as building a Power BI dashboard differs from refreshing a published report.
Before:
“Built a Tableau dashboard using SQL and Excel.”
After:
“For a retail sales capstone, cleaned public transaction data in Excel, used SQL joins to analyze monthly category performance, and built a Tableau dashboard with filters and documented metric definitions for a mock merchandising recommendation.”
If your prior work was outside analytics, preserve the original job title and add the analytical contribution underneath it. A customer operations coordinator who reconciled weekly ticket data, identified duplicate records, and presented recurring trends has evidence of data quality, reporting, and stakeholder communication. Link a portfolio only when each project is accessible and explains the question, source, method, limitations, and conclusion.
Choose a clean reverse-chronological, project-forward, or compact technical template based on whether your strongest evidence is paid analyst work, applied projects, or a longer record of reporting and dashboard ownership.
Use this for analyst, reporting, BI, operations, marketing, or finance roles when recent positions show a clear progression from data preparation and SQL analysis to recurring reports, Tableau or Power BI dashboards, and stakeholder recommendations.
Use this for an entry-level candidate, career changer, intern, or bootcamp graduate whose portfolio projects provide the clearest evidence. Place selected projects near the top, with the business question, data source, cleaning or validation work, method, and deliverable.
Example: "Analyzed customer support tickets in SQL, standardized issue categories, and built a Power BI report to identify recurring service themes."
Use this for an experienced data analyst with several relevant roles, especially if you own metric definitions, data quality checks, dashboard maintenance, or reporting for multiple teams. Give experience priority, then group SQL, Excel, Python, Tableau, Power BI, and other tools in a concise skills section rather than letting software names dominate the page.
A credible data analyst bullet names the business question, data source or scope, analytical work, deliverable, and decision supported. For example, distinguish between reviewing a dashboard and independently cleaning data, defining metrics, building a report, and presenting findings to operations, product, marketing, or finance stakeholders.
Describe SQL through work you performed, not a proficiency label alone. State whether you wrote joins, aggregations, CTEs, transformations, or validation checks; worked with existing queries; and used the results for a report, dashboard, or recommendation. Only claim independent query development if you can explain your approach in an interview.
Yes, grouping data analyst skills by working proficiency can prevent a course-level exposure from looking like production experience. Put tools you use independently in the main skills list, and label limited familiarity or coursework separately when relevant. Support important skills with matching experience or project evidence.
Coursework and personal projects can strengthen an entry-level data analyst resume when they show a complete analytical workflow. Frame each project around the question, dataset, cleaning or validation steps, method, visualization or report, findings, limitations, and recommendation rather than listing a dataset and software names alone.
List SQL, Excel, Tableau, and Power BI only at the level you actually used them. Clarify whether you refreshed a report, maintained an existing dashboard, created visualizations, wrote data transformations, or built and documented a dashboard from source data. This helps hiring teams assess ownership beyond a simple tool list.
Keep a data analyst resume to one page when your relevant experience, projects, and credentials fit clearly there; two pages can be appropriate for experienced analysts with substantial, relevant work. Prioritize recent analytical impact, domain knowledge, and tools over older or unrelated duties, and remove repetitive dashboard or reporting bullets.
Use standard section titles, a simple reverse-chronological layout, and terminology that appears in the target job description when it truthfully matches your background. Include relevant tools, deliverables, and domain terms in context, such as SQL, metric definitions, dashboard development, data validation, or funnel analysis, instead of relying on an isolated keyword block.
A portfolio is most useful when it gives a hiring team accessible evidence of analysis beyond your work history, especially for early-career candidates or career changers. Link projects that explain the business question, data source, preparation, method, findings, and recommendation; omit links that are empty, inaccessible, or expose confidential information.
Show scope and outcome without revealing restricted figures, names, or records. Use approved percentages, ranges, time periods, record-volume bands, team scope, or process improvements, such as reducing manual reconciliation steps or improving report reliability. Keep client, financial, personal, health, and proprietary data out of the resume.
Data analyst certifications add value when they support a relevant skill, employer requirement, or career transition and are paired with applied evidence. List the credential, issuing organization, and completion date when useful, but do not treat a certificate as proof of independent SQL, statistical, or dashboard development ability without projects or experience to support it.